STARE RTI quick-look plots
|
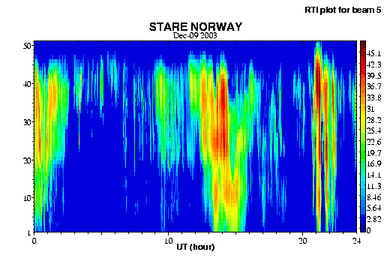
STARE RTI plots are Range - Time - Intensity plots. They are available for each of the two radars (Norway and Finland) separately. The plots show the amount of backscatter (colour scale, in dB) that a radar receives at a certain distance (scale on the left, in so-called "range gates") at a certain time (scale on the bottom). Only when and where the radars receive backscatter, the ionospheric electric field can be determined.
|
Event selection form:
Choose a day:Or, view all RTI plots grouped by year/month (Summary plots included):