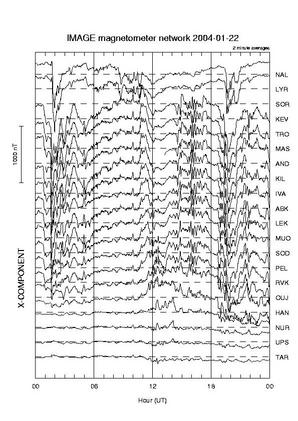
Example plot:
X component of IMAGE magnetometers on Jan 22, 2004.
(Click to get a larger version)
Magnetograms show the variation of the magnetic disturbance on the ground. The three components plotted are:
X = geographically northwards
Y = geographically eastwards
Z = vertically downwards
Values are one-minute averages